Double Pendulum Visualization
I’ve been playing around with the Hamiltonian Physics Solver I wrote using TensorFlow to create some visualizations of the double pendulum system. This is one of the simplest systems which exhibits chaotic behavior. However, for some initial conditions the double pendulum is not chaotic. These regions can be visualized by setting up a grid of pendulums (30 by 28) each with slightly varying initial conditions for the two angles of the pendulum. Then simulating the pendulums starting with zero velocity, reveals the periodic and chaotic regions very quickly:
The periodic regions are associated with lower energy, where the differential equations can be approximated by those of coupled oscillators. I also recreated a version of a cool visualization from wikipedia. Here each pixel represents a simulated double pendulum and the color is the log of the time it takes for the second pendlum to flip. White indicates no flip occurred during my simulation. Blue indicates the flip occurred sooner and yellow indicates it took longer to flip.
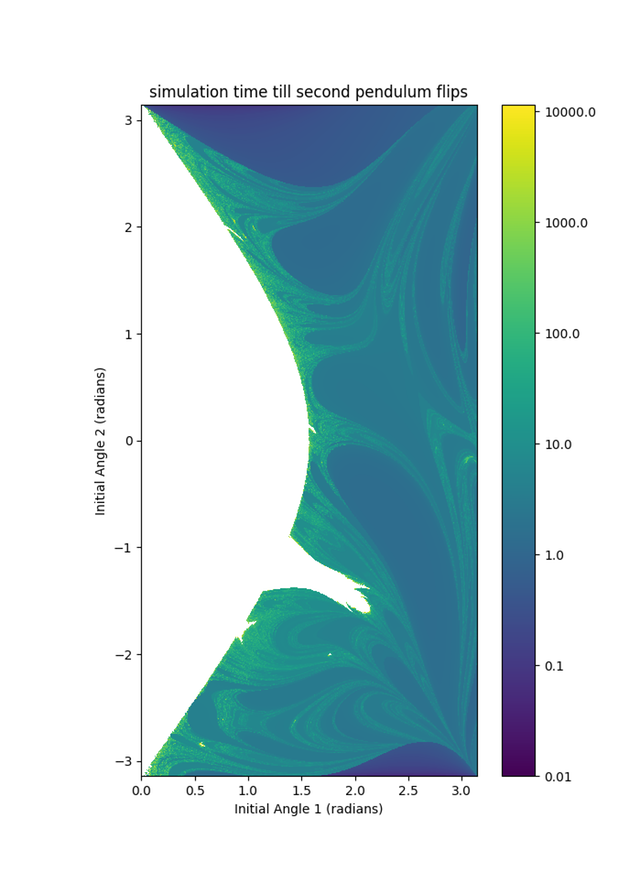
UPDATE: I made an interactive version of the above plot. In this version you can click on it and see the corresponding pendulum animation.